Main dashboard
After successfully logging in, AdEngine displays an "at-a-glance" dashboard, that is designed to give AdOps users a way to understand:
- The traffic on Sebenza's Content Portal
- The campaigns that are actively running
- An basis for historical comparison
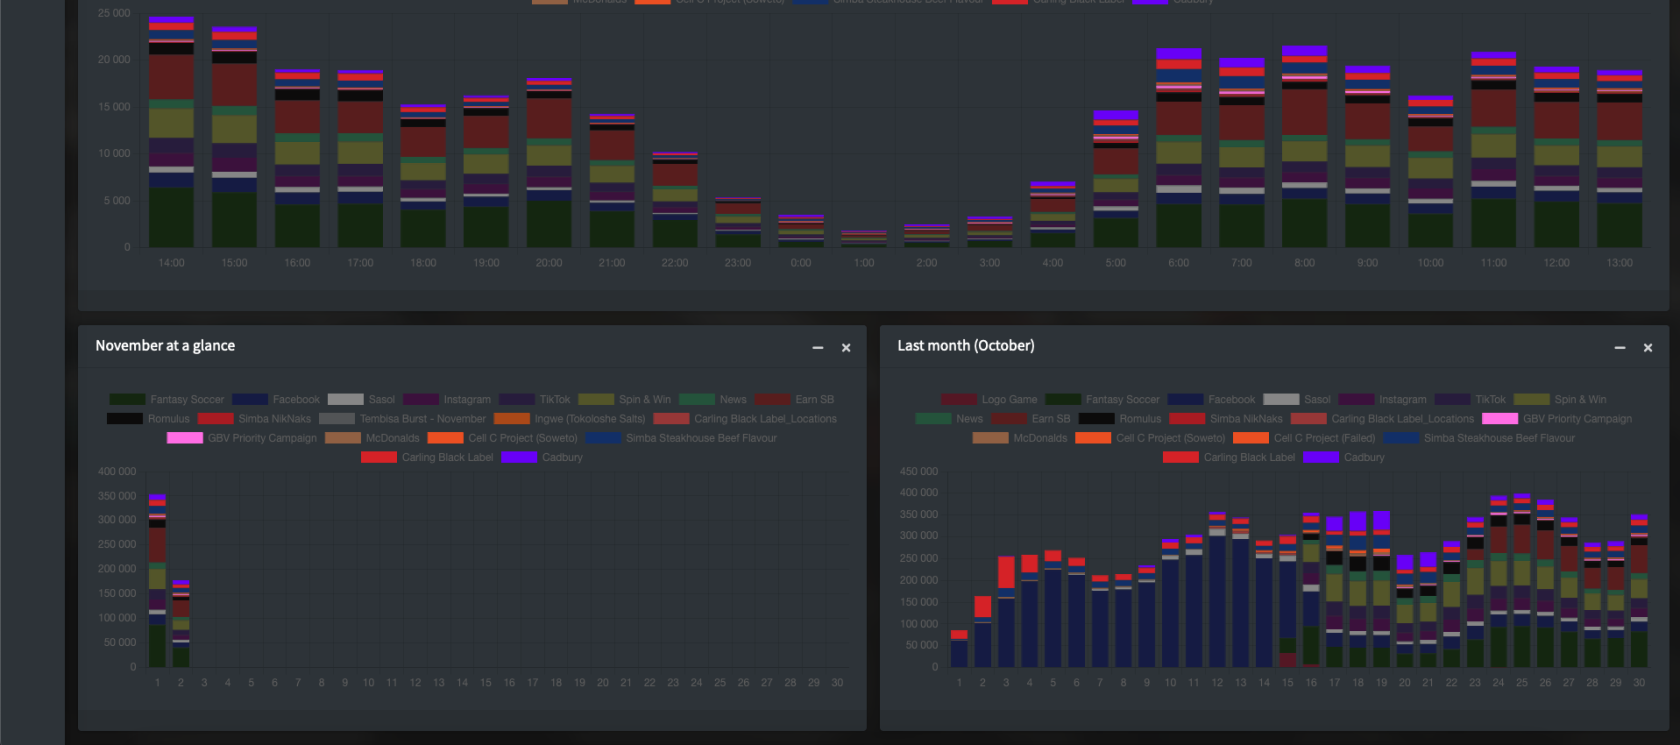
AdEngine's AdOps dashboard, shown here from a screenshot dated 2nd November 2023.
Widgets
The first row of the dashboard is made up of five widgets, which provide real-time data of successful impressions on AdEngine. They are:
- Impressions since 12am today
- Total impressions from yesterday
- Total impressions from this last Monday
- Total impressions for the current month
- Total impressions for the previous month
Campaign impression graphs
The bar graphs that show below the widget row, provide an at-a-glance look into campaign impressions, either by hour, or by day.
Each bar in the graph is made up of a stack that represents an active campaign - their colours correspond to the legend of the graph itself.
As a rule, AdEngine attempts to show backfill campaigns in darker, muted colours, with impression-limited campaigns showing up as brighter, and typically occupying the top of the bar.
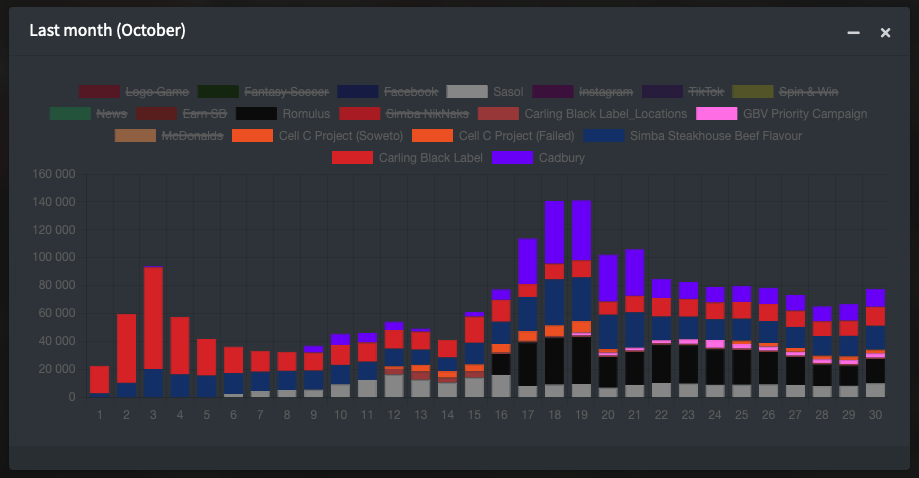
You can click on items in the legend to show or hide specific campaigns from the view:
Note how many campaigns have been prevented from showing on this graph: their legends are shown as crossed out. Clicking them again will add them back to the graph.


No Comments