Reporting
An overview of the campaign reporting abilities within AdEngine, as well as a guide to monitoring the health of active campaigns
Main dashboard
After successfully logging in, AdEngine displays an "at-a-glance" dashboard, that is designed to give AdOps users a way to understand:
- The traffic on Sebenza's Content Portal
- The campaigns that are actively running
- An basis for historical comparison
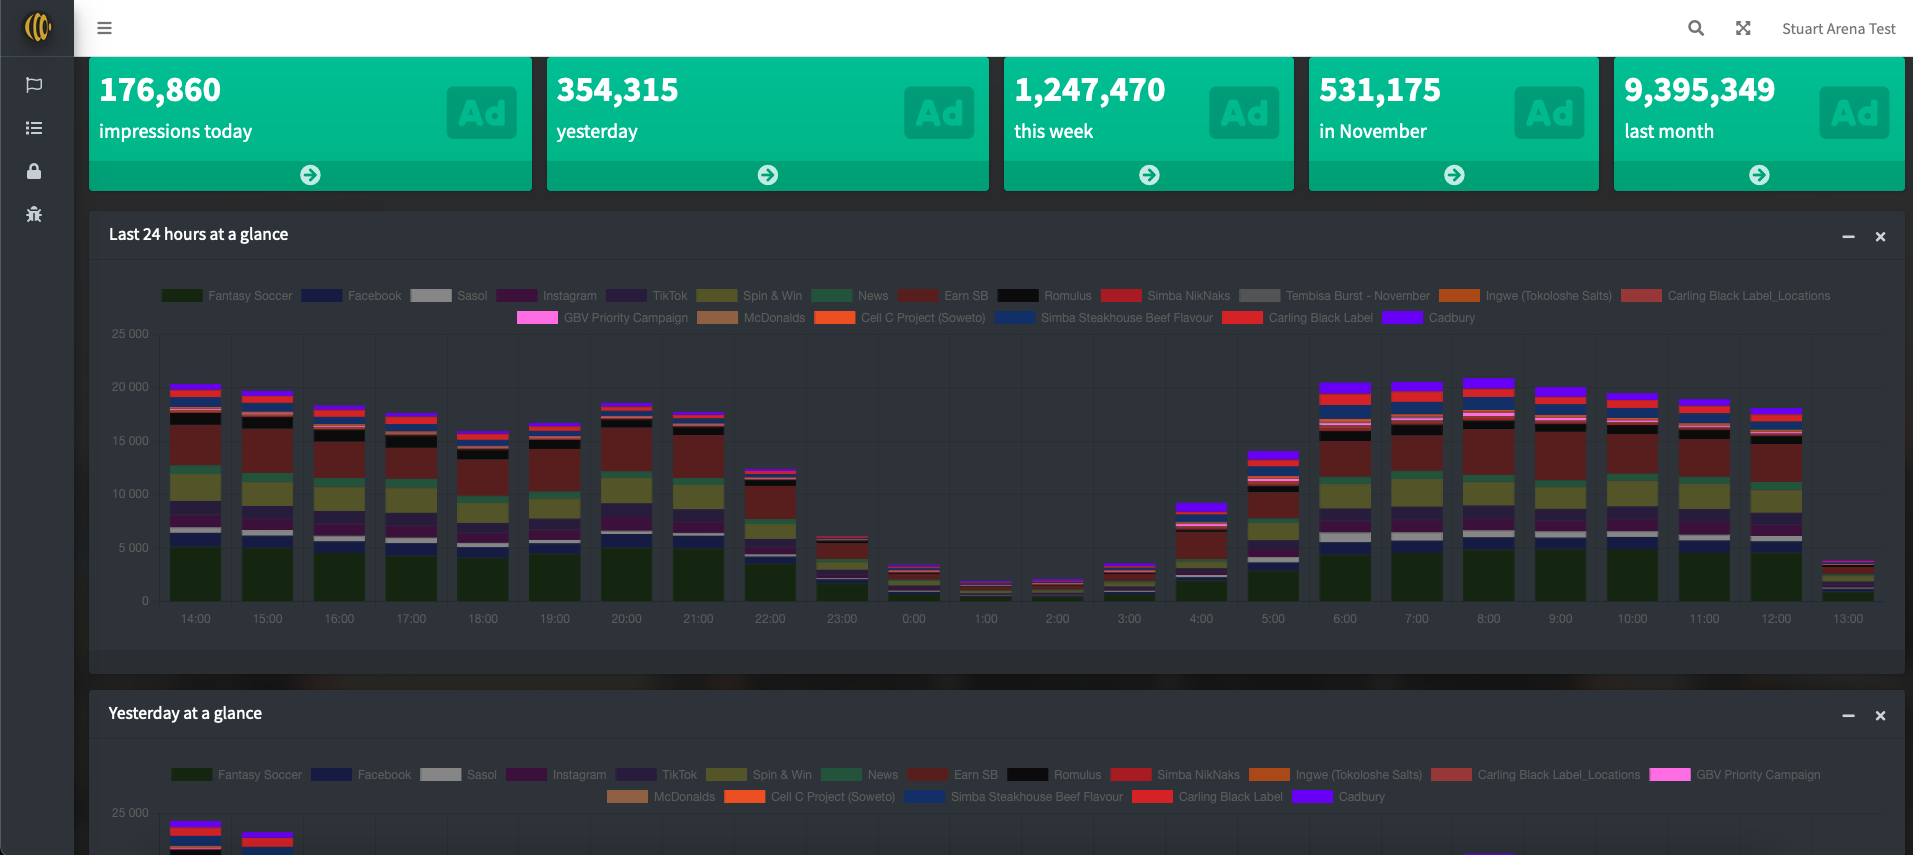
AdEngine's AdOps dashboard, shown here from a screenshot dated 2nd November 2023.
Widgets
The first row of the dashboard is made up of five widgets, which provide real-time data of successful impressions on AdEngine. They are:

- Impressions since 12am today
- Total impressions from yesterday
- Total impressions from this last Monday
- Total impressions for the current month
- Total impressions for the previous month
Campaign impression graphs
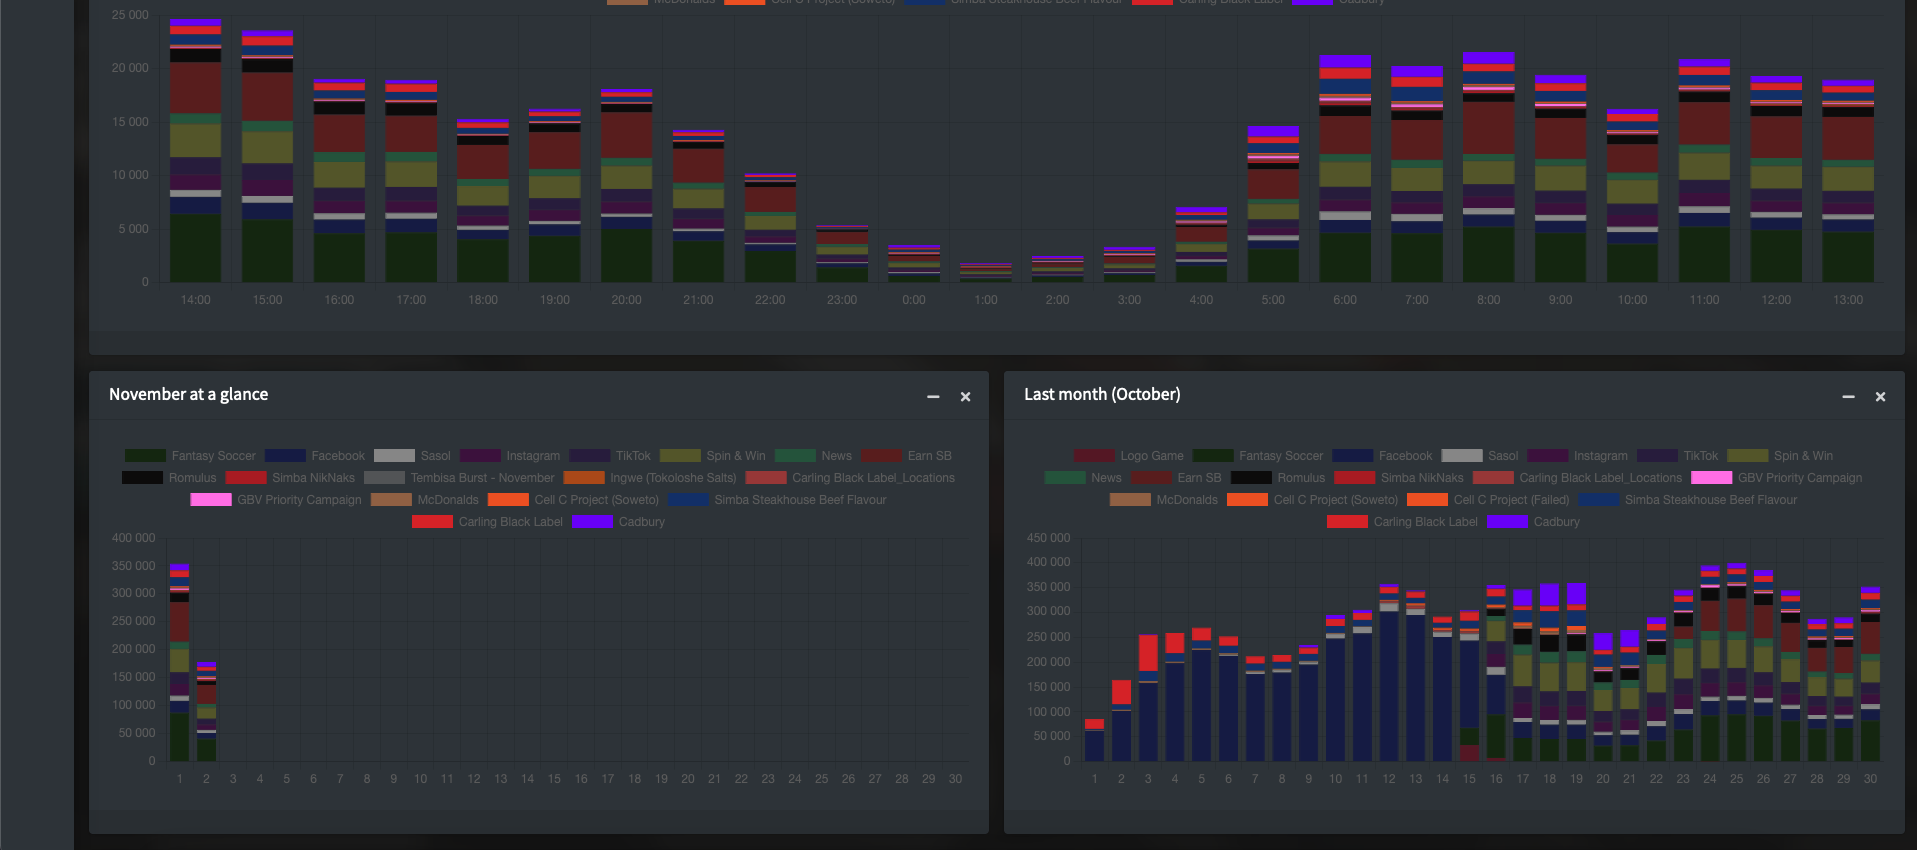
The bar graphs that show below the widget row, provide an at-a-glance look into campaign impressions, either by hour, or by day.
Each bar in the graph is made up of a stack that represents an active campaign - their colours correspond to the legend of the graph itself.
As a rule, AdEngine attempts to show backfill campaigns in darker, muted colours, with impression-limited campaigns showing up as brighter, and typically occupying the top of the bar.
You can click on items in the legend to show or hide specific campaigns from the view:
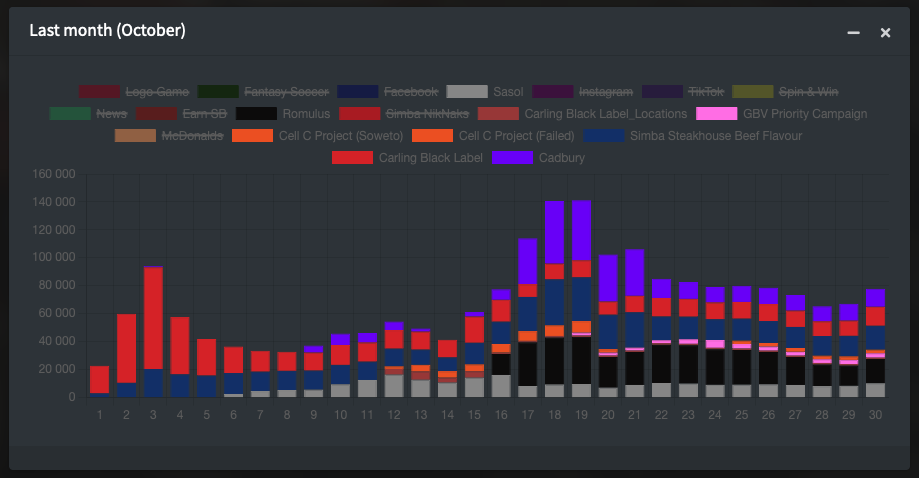
Note how many campaigns have been prevented from showing on this graph: their legends are shown as crossed out. Clicking them again will add them back to the graph.
Campaign reporting
Each active campaign in AdEngine has a dashboard. It is intended to provide at-a-glance reporting into the health of your campaign.
Campaign list
Reporting starts right inside the campaign list.
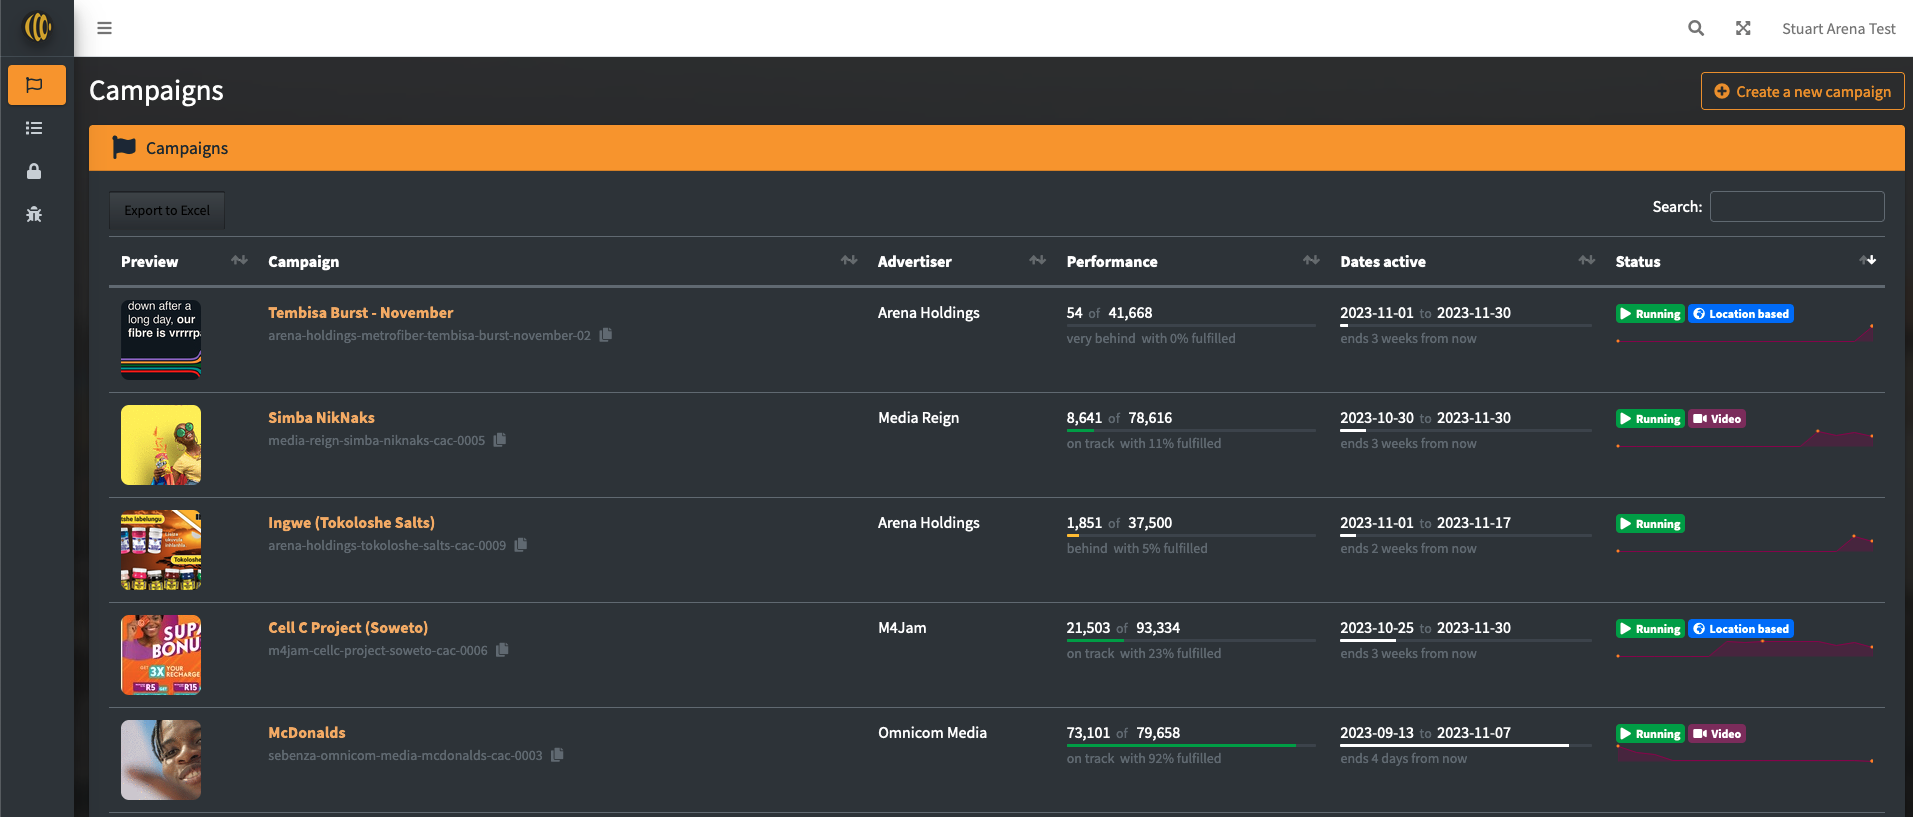
Typical campaign list, showing a variety of useful information. All fields in the table can be ordered, and the Search functionality searches across all fields in real-time.
For each row representing a campaign, you can see the following information:
- A preview of the creatives of the campaign. If the image animates, this indicates there is at least one video making up the creatives of the campaign.
- The campaign title. Below it, is the Unique Campaign ID. Clicking on the copy icon right of it will save it in your clipboard
- Advertiser.
- Performance, showing:
- Number of impressions vs total impression limit
- A line graph indicating impression status. This is coloured to represent the "health" of the campaign.
- A summary to indicate health, and the percentage progression of impressions served.
Note that if AdEngine shows campaigns as "slightly behind", "behind" or "very behind", it is adapting its serving to prioritise these campaigns to help them "catch up"
- Dates active, showing:
- Start and end dates
- A time progress bar
- A text description of the time elapsed so far (e.g. "2 weeks to go")
- Status, showing:
- Badge or badges describing the campaign, including:
- Active / Paused / Pending / Cancelled / Rejected
- Location-based
- Has video
- A "spark graph" which provides a snapshot of impression traffic over the last 14 days
- Badge or badges describing the campaign, including:
From here, AdOps users can very clearly see how their campaigns are doing.
Campaign dashboard
Clicking on any active campaign will open up its dashboard, which provides more in-depth analytics about the campaign.
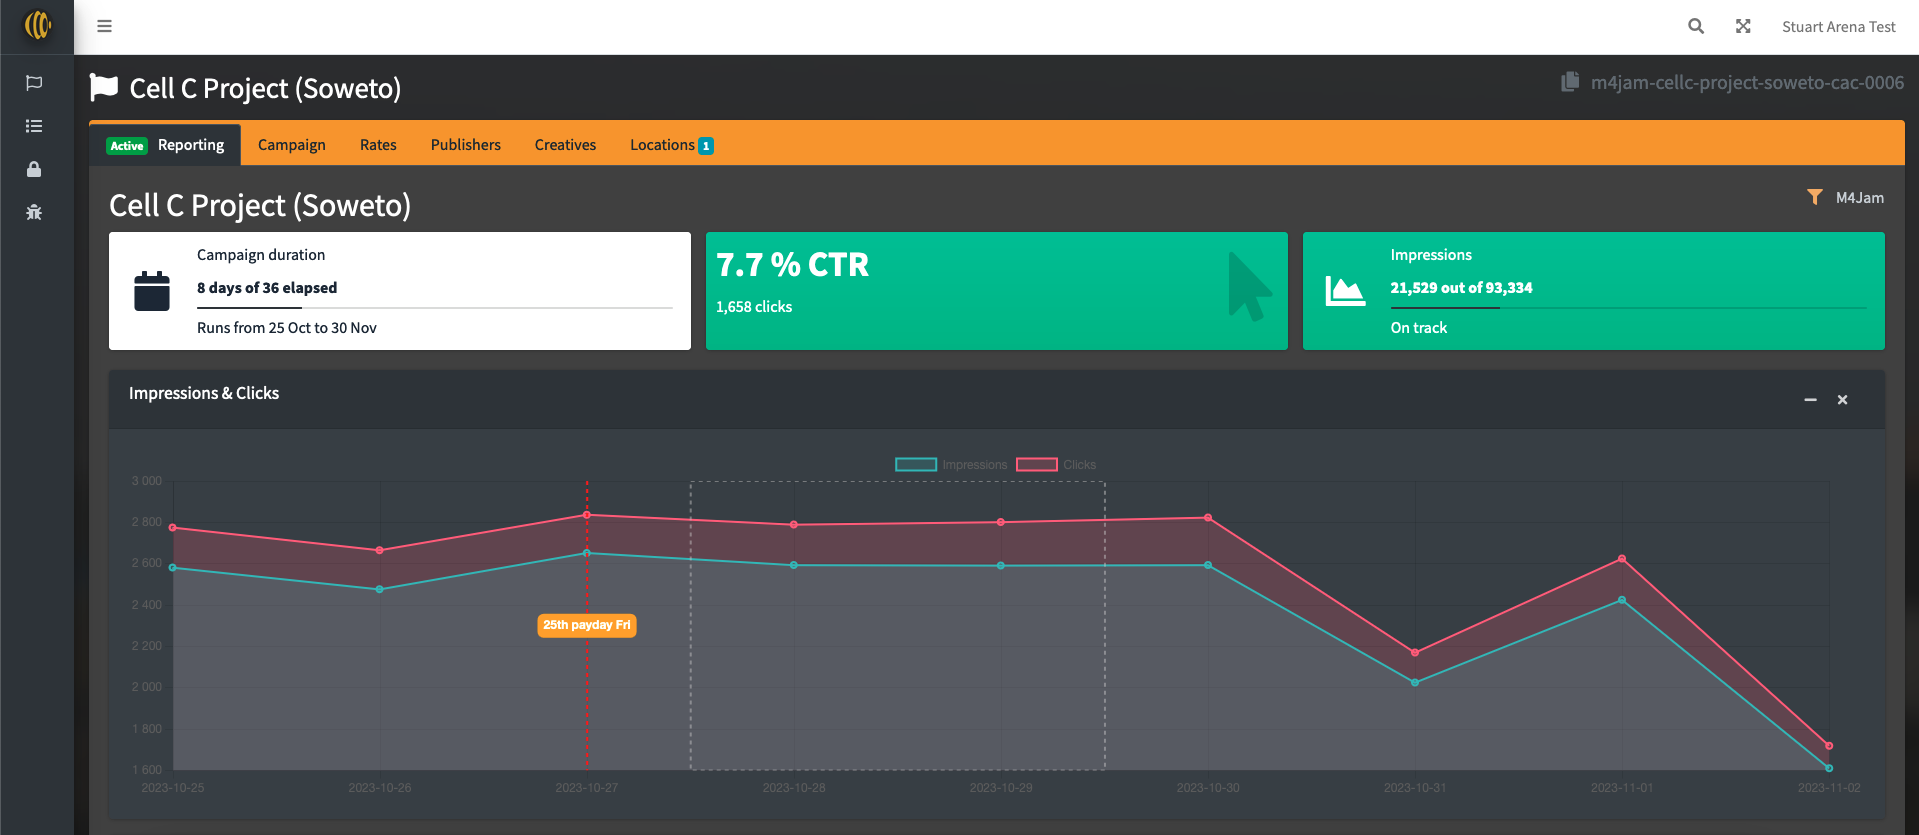
The first row shows three widgets about the campaign:
- Campaign duration and progress
- Overall CTR (Clickthrough rate), expressed as a percentage and as click count
- Overall impressions.
The line graph below the widgets shows a per-day click-and-impression chart, from when the campaign started.
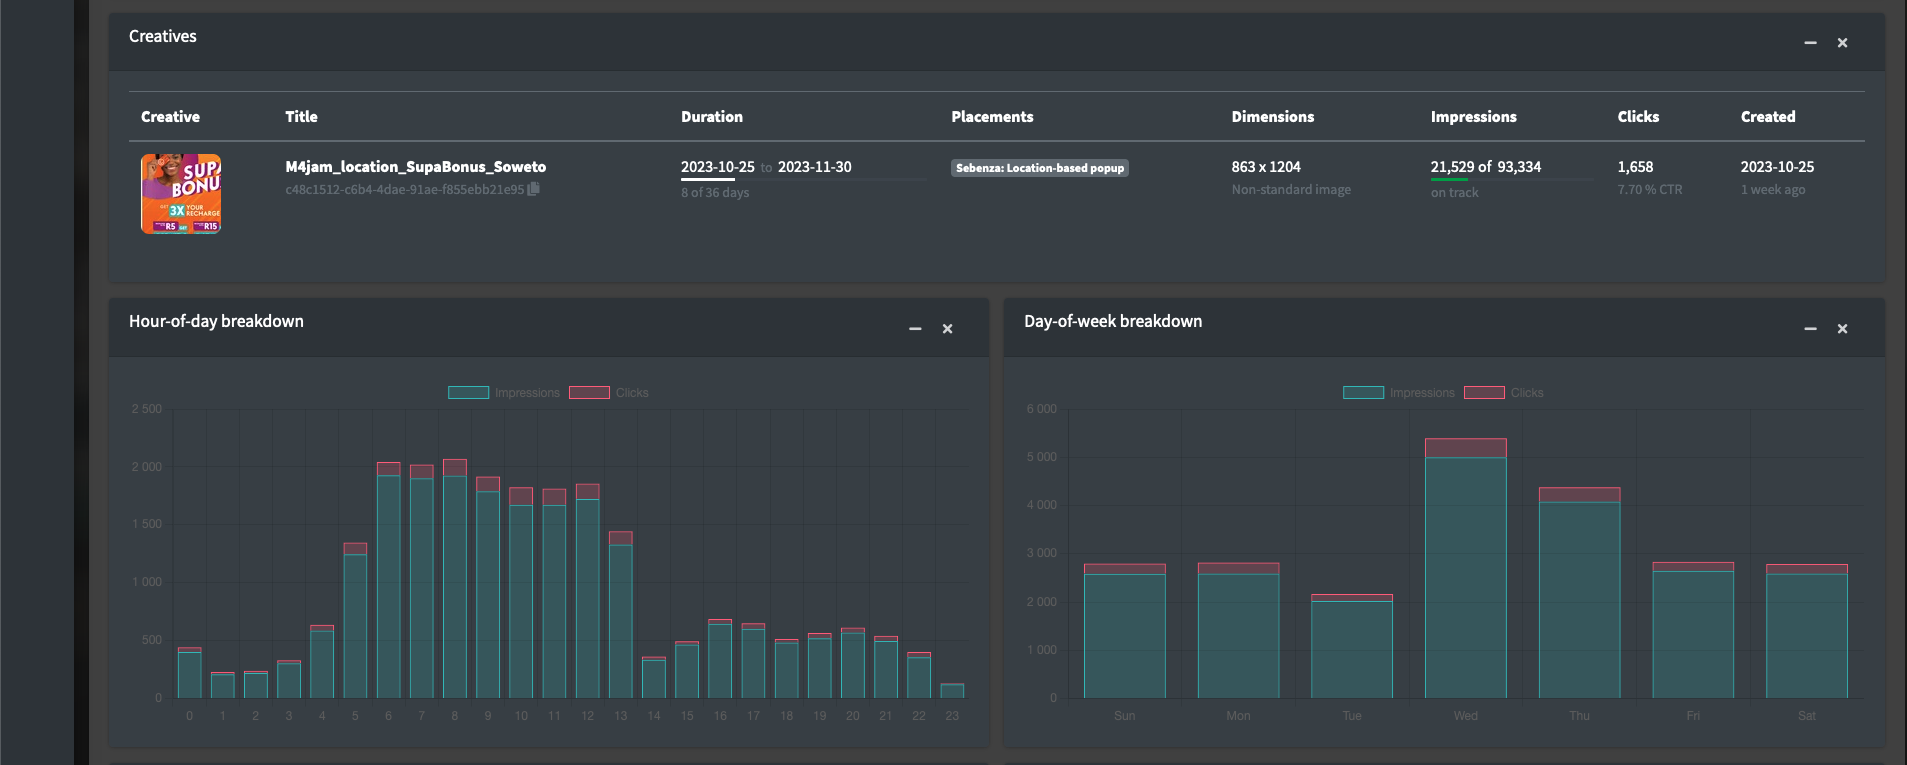
Following this:
- A creatives breakdown, showing individual statuses of health per creative, illustrating:
- A creative preview thumbnail
- The creative's title, and below it, its unique ID
- The duration and progress
- Where the creative is flighting
- Its dimensions and media type
- Impressions, and impression progress and health
- Clicks, and CTR
- When the creative was created
- An hour-of-day breakdown, which hours of the day the campaign enjoys the most and least impressions and clicks
- A day-of-week breakdown, similarly showing which days of the week the campaign enjoys the most and least impressions and clicks.
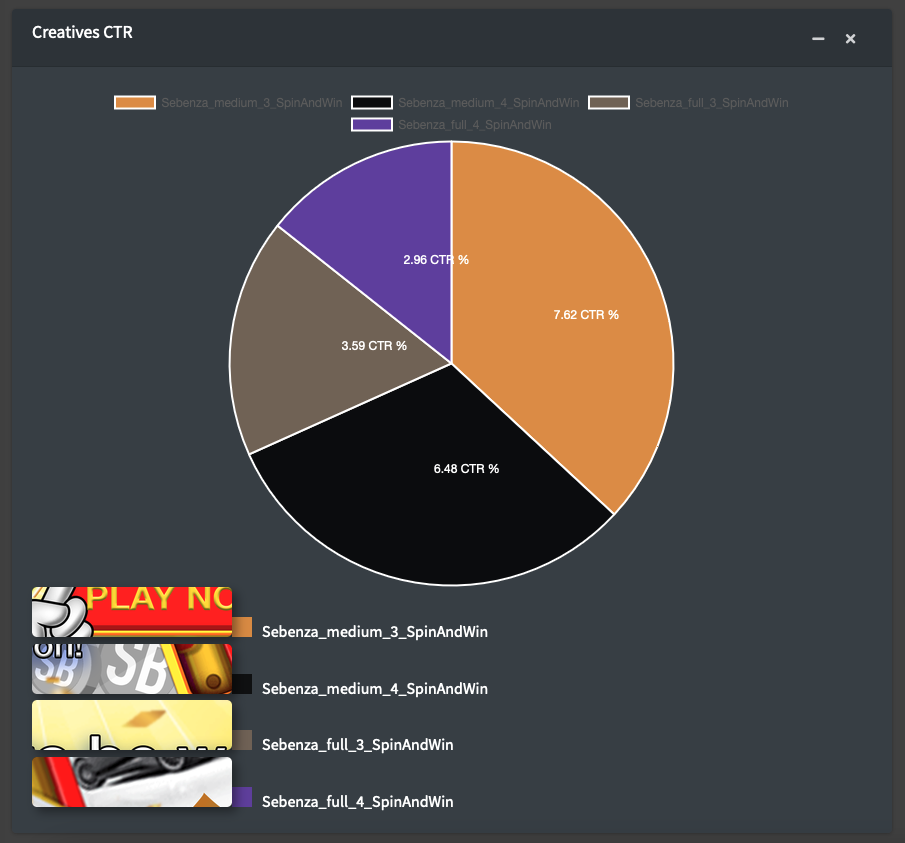
Finally, the Creatives CTR pie is shown, which clearly indicates which creatives are attracting the most clicks.
Filtering
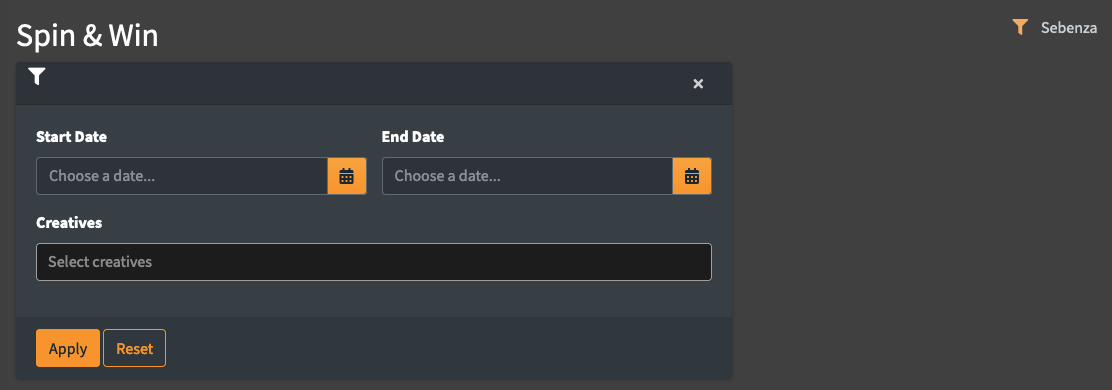
On the top right of the Campaign Dashboard view, is a small funnel icon. Clicking it reveals the Filter options.
From here, you can limit your reporting between two specified dates, or, you can exclude or include specific creatives via the Creatives tabs input.
Clicking Apply will make the changes to the dashboard
Clicking Reset will undo all filters, and revert the dashboard back to its default.